WarnerMedia has logged single-digit growth in representation of women and people of color on both sides of the camera and in its workforce over the past year, according to the studio’s newly released Equity and Inclusion report for 2020-21.
On the production side, WarnerMedia has seen overall stronger growth in representation for women and people of color in behind-the-camera roles than it has with on-screen roles. The number of women in on-screen roles in Warner Bros. films dropped 4% in the 2020-21 period measured in the report, compared to the 2019 period. But in all other key areas measured, women and people from BIPOC backgrounds logged gains. Women logged the biggest gain in senior management promotions among the company’s nearly 30,000 workers.
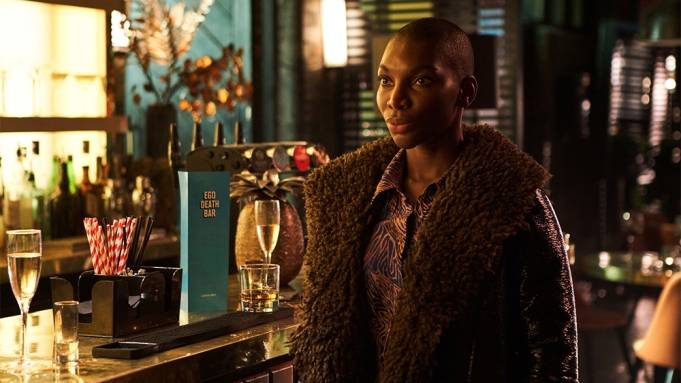
WarnerMedia issued a detailed, 105-page report complete with glossy features on its work on diversity, equity and inclusion in the wake of the tumultuous incidents that returned the Black Lives Matter movement to prominence and spurred other activism on social justice issues. The report emphasized the company’s response to the jolts of last year, with a number of new talent development programs and its heightened search for BIPOC creators and stories to tell, such as HBO’s distinctive limited series “I May Destroy You,” from multi-hyphenate British auteur Michaela Coel.
IATSE Reports ‘Good Progress’ in Talks, While Prepping 21 Picket Locations
WarnerMedia committed to a broad disclosure of the company’s diversity and inclusion statistics on a regular basis as part of a larger commitment to social change that the company made with actor Michael B. Jordan in September 2018 around the release of the Warner Bros. Pictures legal drama “Just Mercy.”
“Stories that deeply resonate can change how a person contextualizes the world,” said Jason Kilar, CEO of WarnerMedia. “Not only do we get to work on this, but we get to work on this at scale. We are a missionary team of nearly 30,000 team members… inspired, passionate and, of course, with the potential to do far more. And that is a good thing given there is so much more to do. These were important steps towards making WarnerMedia more equitable and inclusive. And yet we all acknowledge that the bulk of the work is still in front of us.”
SCRIPTED TELEVISION
On Camera roles
36% women, up 2% from 2019
29% people of color, up 5% from 2019
Behind the Scenes roles
28% women, up 5% from 2019
29% people of color, up 6% from 2019
WARNER BROS. PICTURES
On Camera roles
30% women, down 4% from 2019
29% people of color, up 5% from 2019
Behind the Scenes roles
27% women, up 4% from 2019
27% people of color, up 4% from 2019
ANIMATION
4% of animated protagonists in development at Cartoon Network are female
52% of lead characters in development at Warner Bros. Animation are female
For WarnerMedia’s employee workforce, the numbers were little changed from the company’s 2019 and 2018 benchmarks on gender, race and ethnicity.
The company’s overall workforce is 54% male and 46% female. Senior leadership (defined as vice president and above) is also a 54/46 ratio, unchanged from 2018. Women account for 48% of management roles and 45% of non-management roles. Women accounted for 52% of senior leadership promotions in 2020-21 and 49% of management elevations.
As for race and ethnicity within the WarnerMedia workforce, the numbers are also largely unchanged from 2018, although the percentage of white employees has dropped 3% to 58%. Asian American representation grew to 12% from 11% in 2018; Black representation dropped 1% to 12%. The Hispanic/Latinx population was unchanged at 11%. WarnerMedia’s survey showed the number of respondents in the “declined to state” category on ethnicity grew by 2% from 2018 to 3% of the workforce.
Among senior leaders, 72% are white, followed by Asian Americans (10%), Black (7%) and Hispanic/Latinx (6%). The ratio is similar at the management level: 61% are white, followed by Asian Americans (14%), Black (9%) and Hispanic/Latinix (9%). Non-management jobs are 54% white, followed by Black (15%), Hispanic/Latinx (13%) and Asian American (11%).
source ; Variety


")